Examples
Simple example (simple.py)
from fillplots import plot_regions
plotter = plot_regions([
    [(lambda x: x ** 2,),  # x ^ 2 > 0 and
     (lambda x: x + 5,)],  # x + 5 > 0
])
(Source code, png, hires.png, pdf)

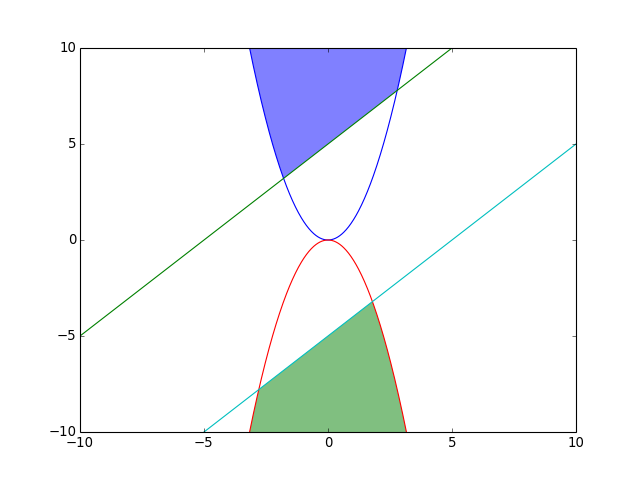
Two regions (two.py)
from fillplots import plot_regions
plotter = plot_regions([
    [(lambda x: x ** 2,),         # x ^ 2 > 0 and
     (lambda x: x + 5,)],         # x + 5 > 0
    # Another region (True means to use "<" instead of ">"):
    [(lambda x: - x ** 2, True),  # - x^2 < 0 and
     (lambda x: x - 5, True)],    # x - 5 < 0
])
(Source code, png, hires.png, pdf)
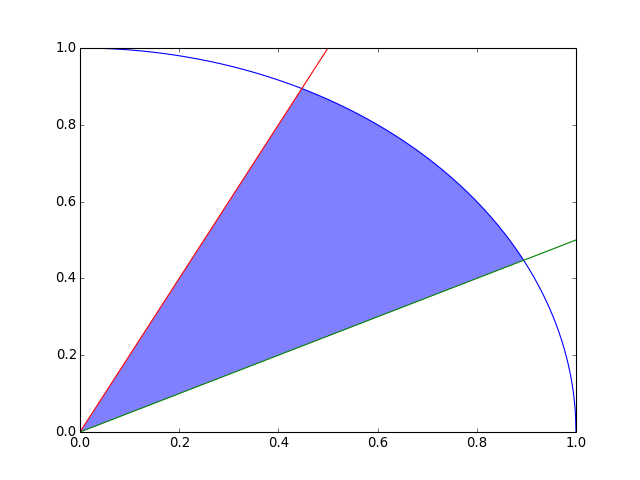
Specifying limits (limits.py)
from fillplots import plot_regions
plotter = plot_regions([
    [(lambda x: (1.0 - x ** 2) ** 0.5, True),
     (lambda x: 0.5 * x,),
     (lambda x: 2.0 * x, True)]
], xlim=(0, 1), ylim=(0, 1))
(Source code, png, hires.png, pdf)

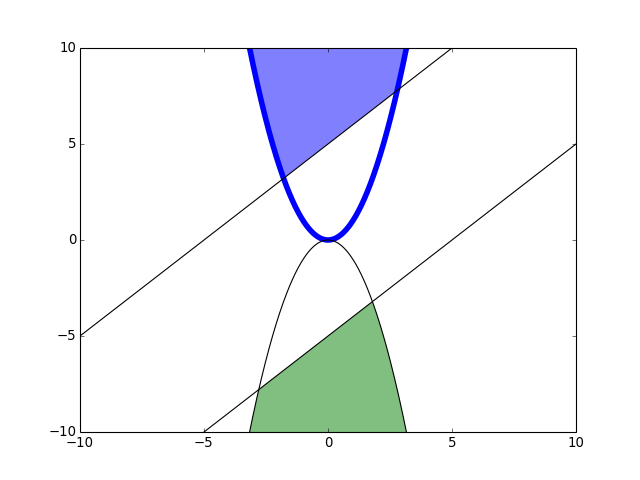
Configure interface (config_inheritance.py)
from fillplots import Plotter
plotter = Plotter([
    [(lambda x: x ** 2,),
     (lambda x: x + 5,)],
    [(lambda x: - x ** 2, True),
     (lambda x: x - 5, True)],
])

# Upstream configuration "propagates" to downstream ones:
plotter.config.line_args = {'color': 'black'}
# Downstream configuration can be tweaked individually:
plotter.regions[0].inequalities[0].config.line_args = {'color': 'blue',
                                                   'linewidth': 5}

plotter.plot()
(Source code, png, hires.png, pdf)

Draw complex region (switching.py)
# To draw complex region, you need to conditionally switch boundaries.

from fillplots import Plotter
plotter = Plotter([
    [(lambda x: x ** 0.5, True),
     (1,),
     (2, True)],
    [(lambda x: x ** 0.5,),
     (lambda x: x, True),
     (2, True)],
    [(lambda x: x * (4 - x) / 2, True),
     (2,)],
], xlim=(0, 4), ylim=(0, 4))
plotter.plot()
(Source code, png, hires.png, pdf)

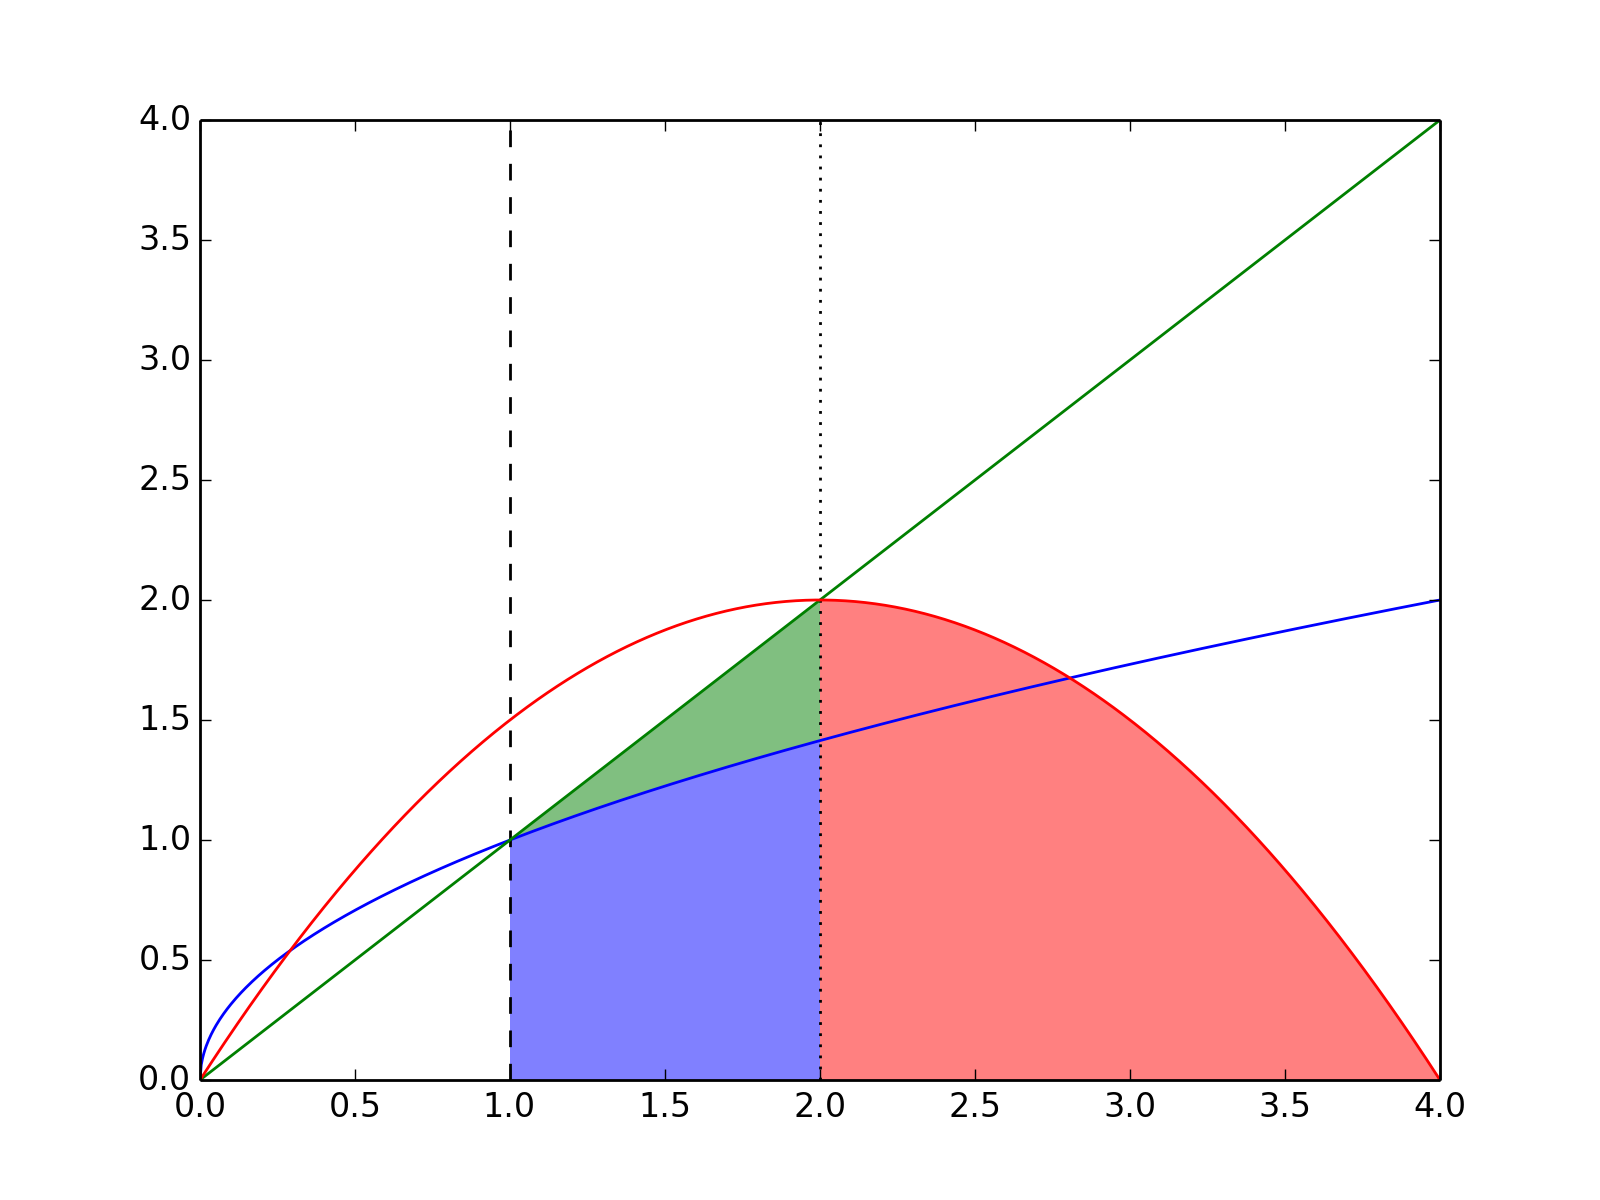
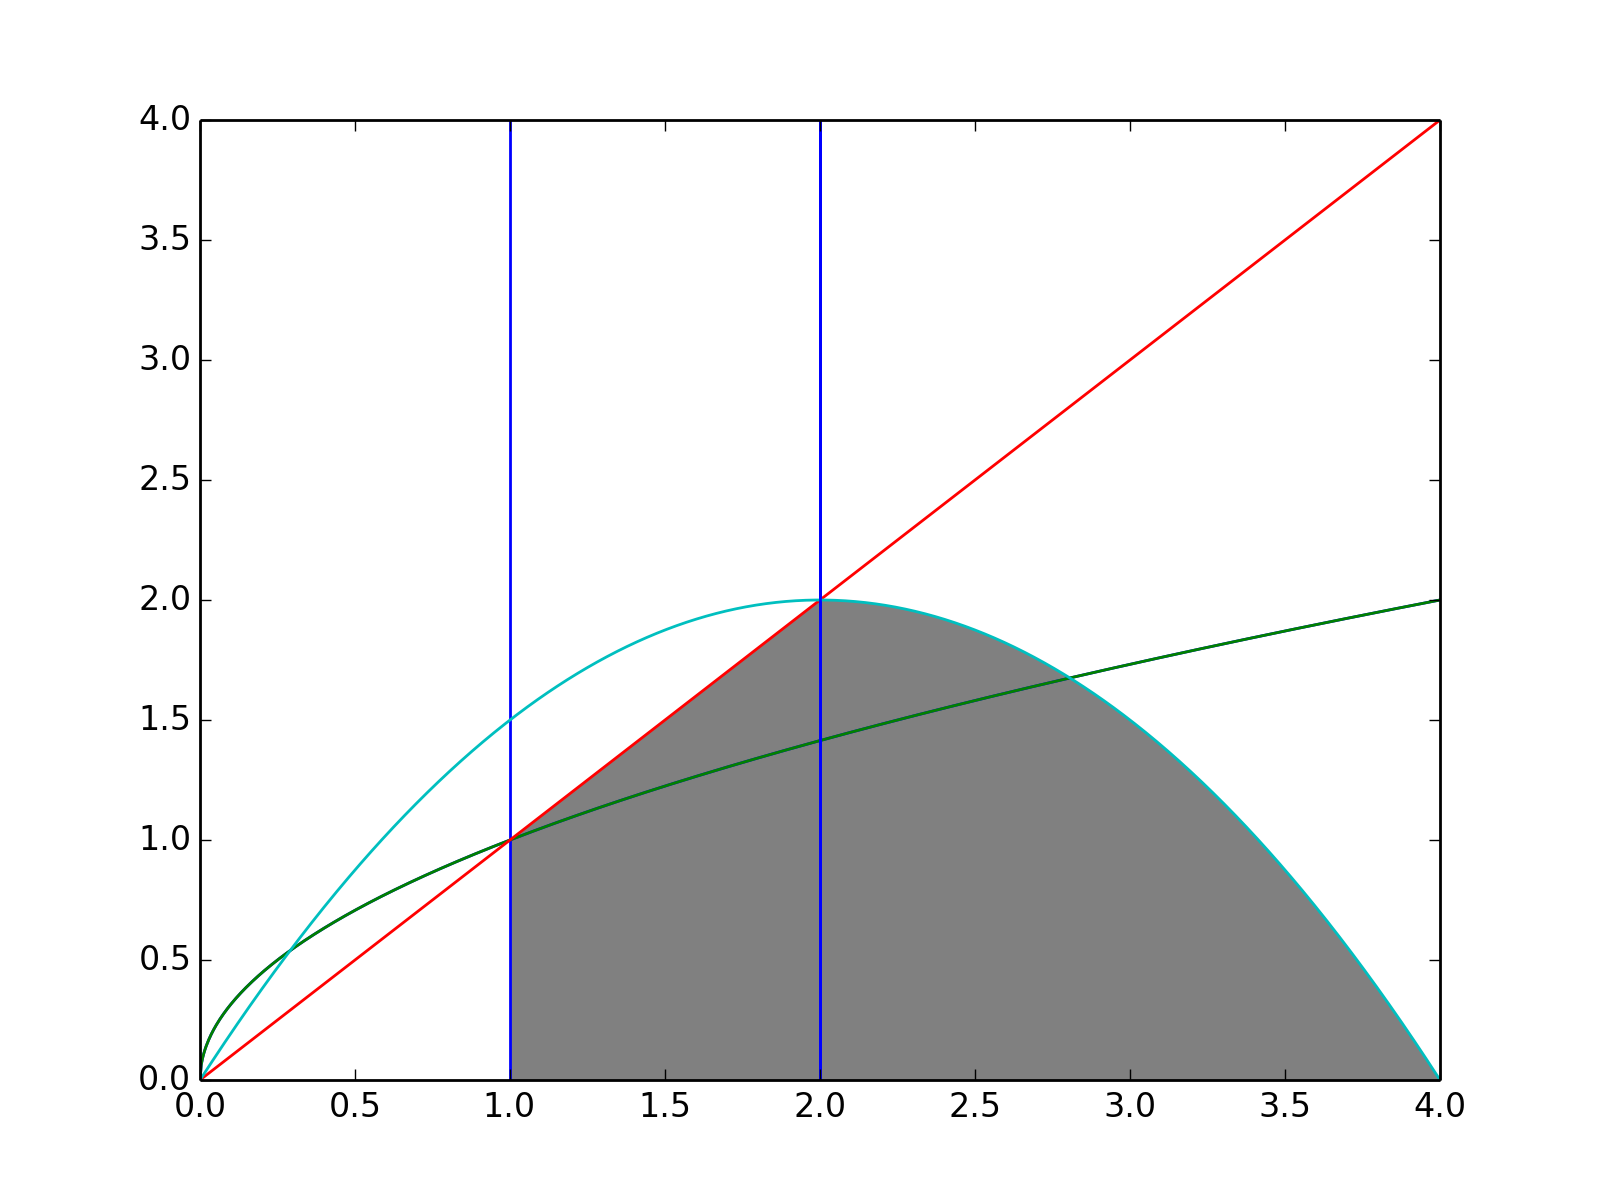
Use of boundary object (switching_uniq_boundary.py)
# Conditionally switching boundaries make many overlapping boundaries.
# To draw just one line per boundary, you can initialize the boundary
# object before creating the Plotter object.

from fillplots import boundary, Plotter

# Initialize boundaries individually, so that they are recognized as
# one line rather than line per region.
sqrt = boundary(lambda x: x ** 0.5)
one = boundary(1)
two = boundary(2)

# Boundaries can be configured before registering to `Plotter`.
one.config.line_args = {'color': 'k', 'linestyle': 'dashed'}
two.config.line_args = {'color': 'k', 'linestyle': 'dotted'}

plotter = Plotter([
    [(sqrt, True), (one,), (two, True)],
    [(sqrt,), (lambda x: x, True), (two, True)],
    [(lambda x: x * (4 - x) / 2, True),
     (two,)],
], xlim=(0, 4), ylim=(0, 4))

plotter.plot()
(Source code, png, hires.png, pdf)

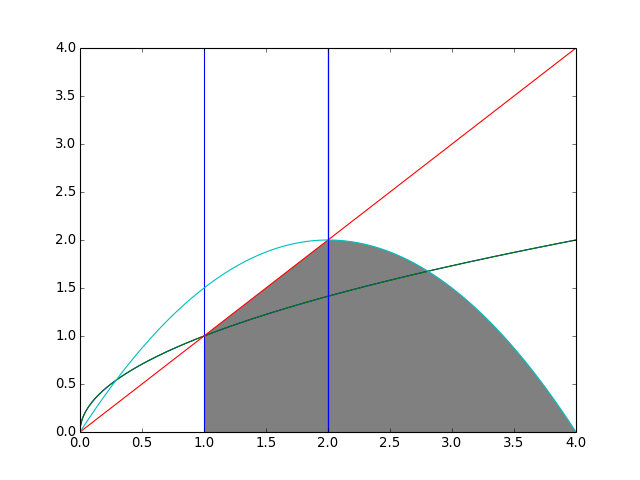
How to set region color (switching_region_color.py)
from fillplots import Plotter
plotter = Plotter([
    [(lambda x: x ** 0.5, True),
     (1,),
     (2, True)],
    [(lambda x: x ** 0.5,),
     (lambda x: x, True),
     (2, True)],
    [(lambda x: x * (4 - x) / 2, True),
     (2,)],
], xlim=(0, 4), ylim=(0, 4))

for reg in plotter.regions:
    reg.config.fill_args['facecolor'] = 'gray'

plotter.plot()
(Source code, png, hires.png, pdf)

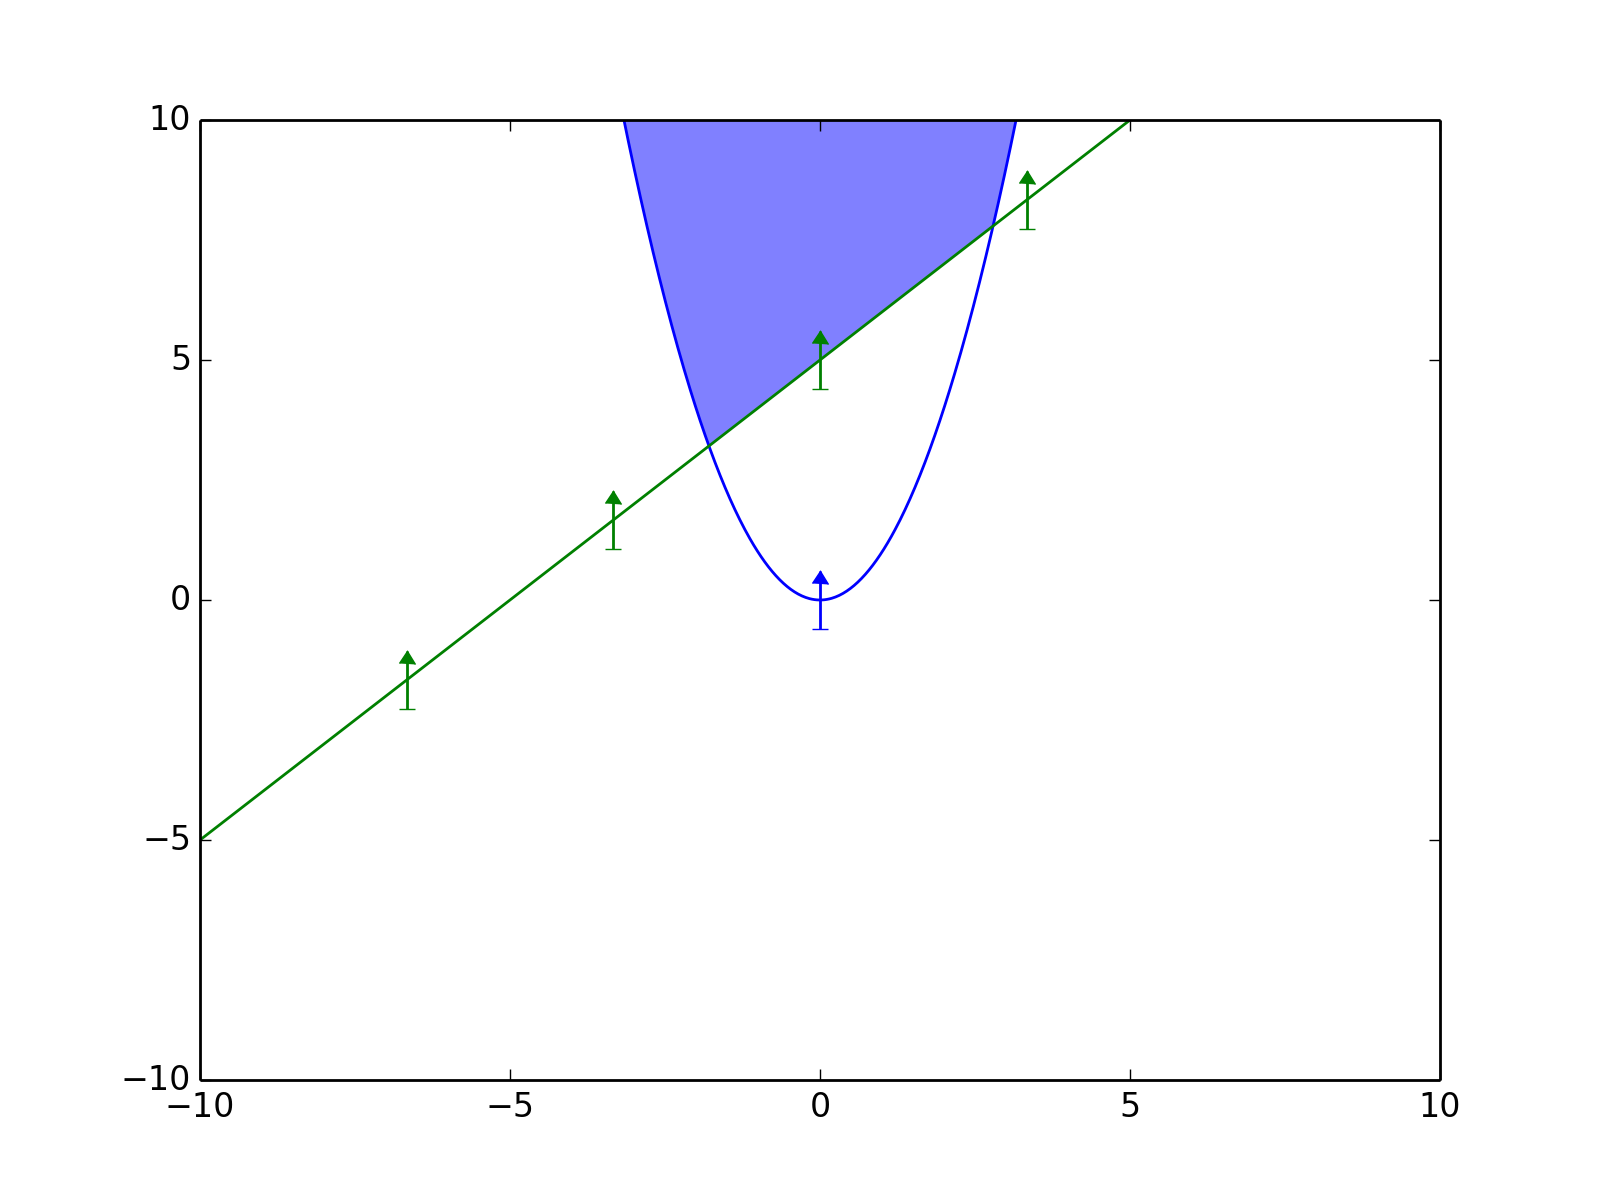
Show which direction makes it positive (positive_direction.py)
from fillplots import Plotter
plotter = Plotter([
    [(lambda x: x ** 2,),
     (lambda x: x + 5,)],
])
plotter.plot()
plotter.plot_positive_direction()
(Source code, png, hires.png, pdf)

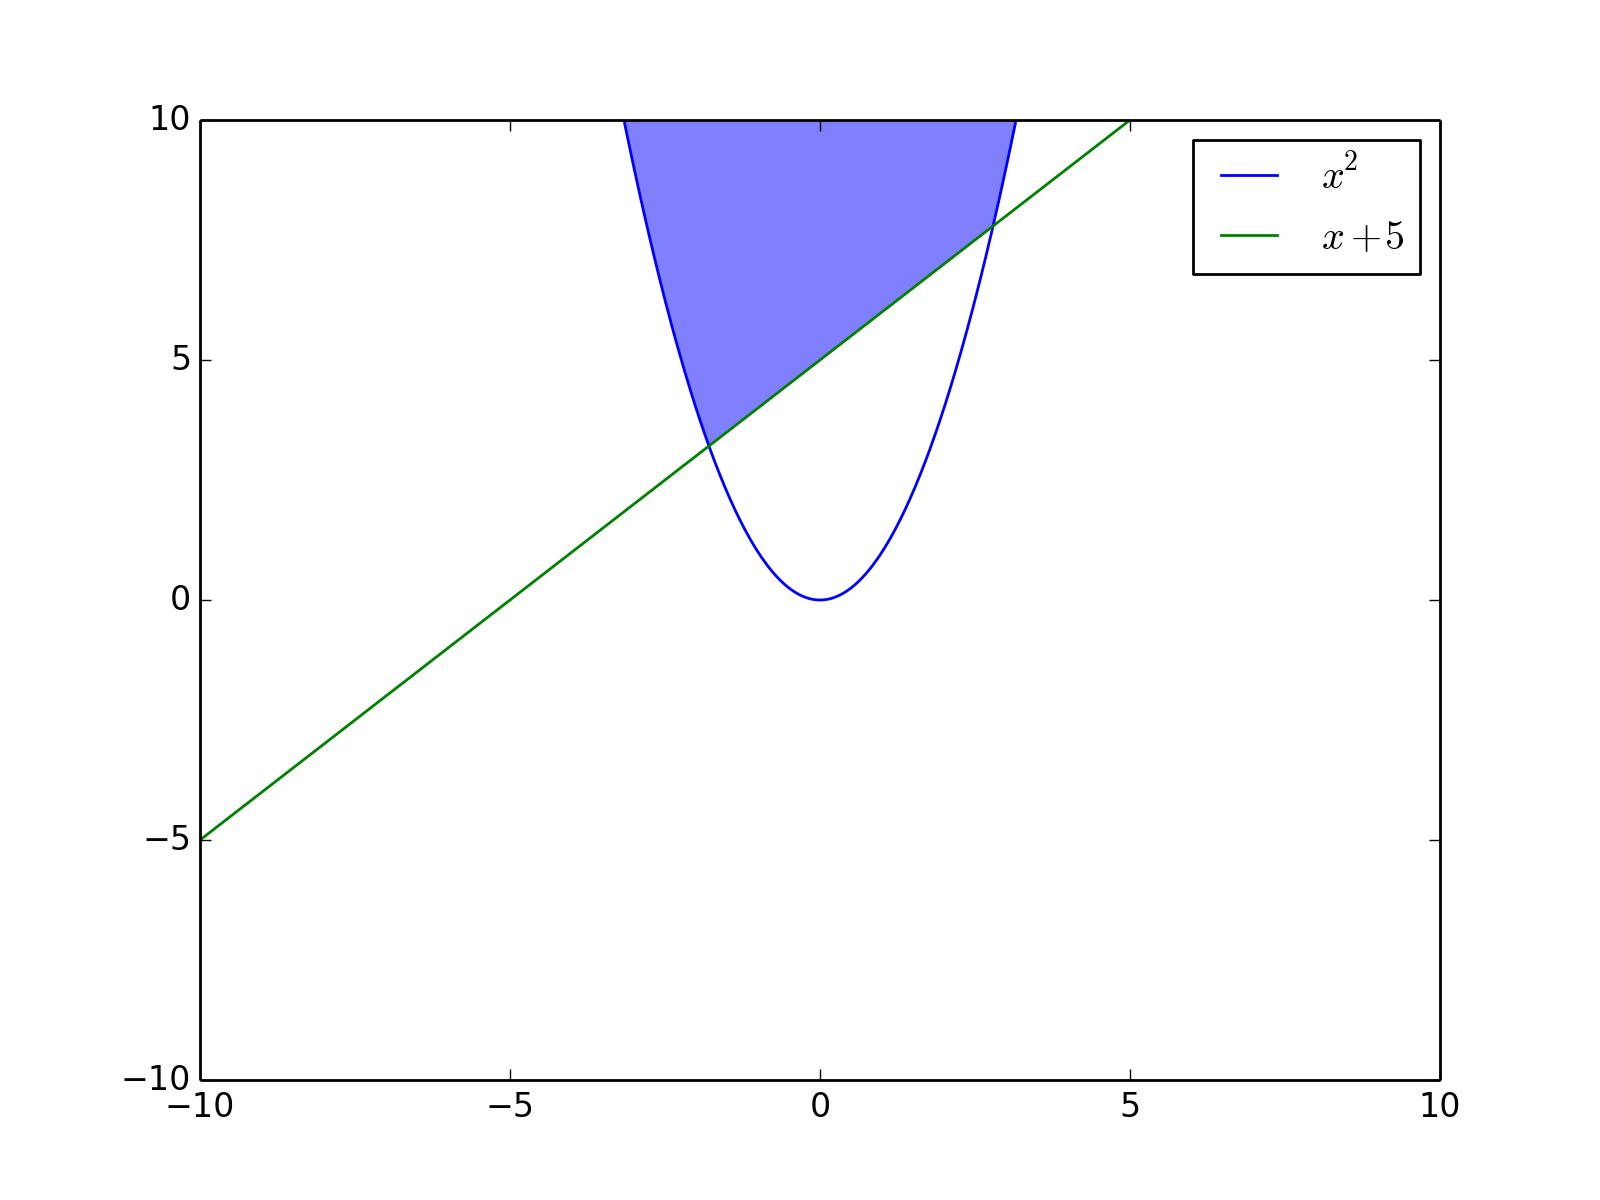
Show boundary labels (boundary_labels.py)
from fillplots import Plotter
plotter = Plotter([
    [(lambda x: x ** 2,),
     (lambda x: x + 5,)],
])
(ineq0, ineq1) = plotter.regions[0].inequalities
ineq0.boundary.config.line_args['label'] = '$x ^ 2$'
ineq1.boundary.config.line_args['label'] = '$x + 5$'
plotter.plot()
plotter.ax.legend(loc='best')
(Source code, png, hires.png, pdf)

How to annotate regions (annotate_regions.py)
from fillplots import Plotter, annotate_regions
plotter = Plotter([
    [(lambda x: x ** 2,),
     (lambda x: x + 5,)],
    [(lambda x: - x ** 2, True),
     (lambda x: x - 5, True)],
])
plotter.plot()
annotate_regions(plotter.regions, 'Annotation')
(Source code, png, hires.png, pdf)

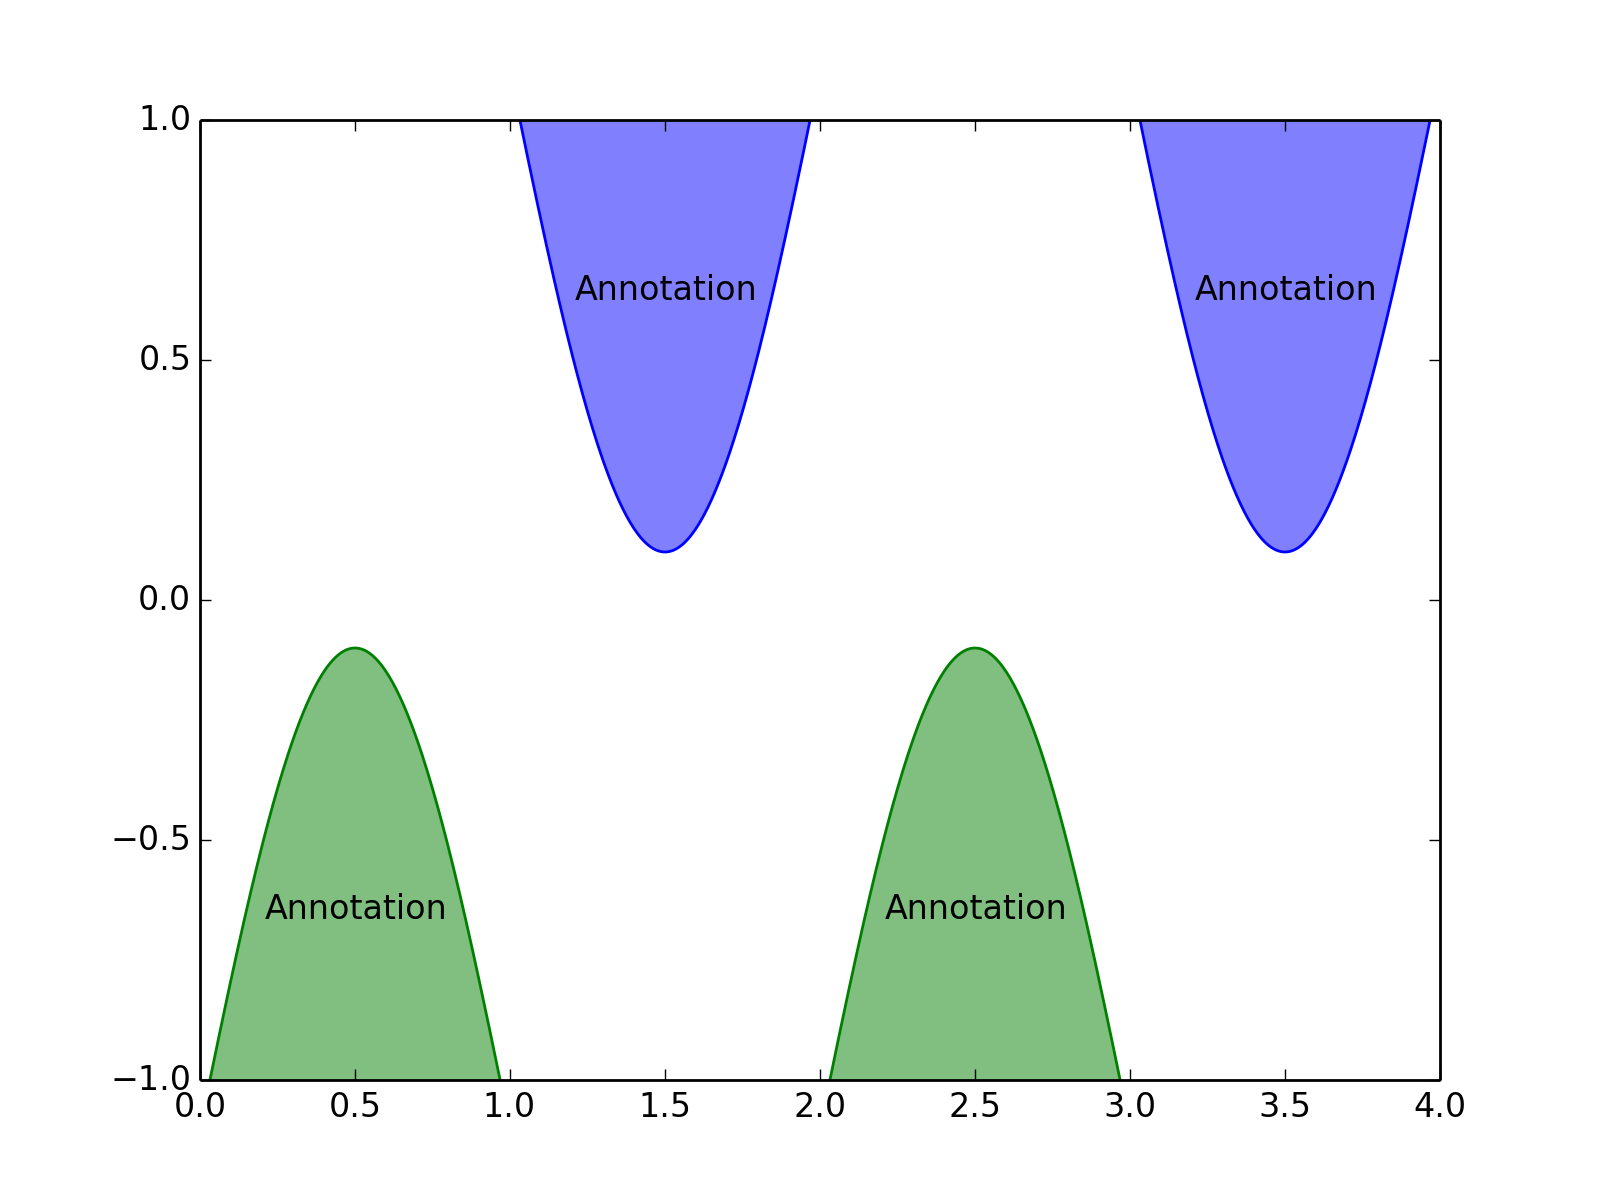
Annotations with discontinuous regions (divide_regions.py)
import numpy
from fillplots import Plotter, annotate_regions
plotter = Plotter([
    [(lambda x: numpy.sin(numpy.pi * x) + 1.1,)],
    [(lambda x: numpy.sin(numpy.pi * x) - 1.1, True)],
], xlim=(0, 4), ylim=(-1, 1))
plotter.plot()
annotate_regions(plotter.regions, 'Annotation')
(Source code, png, hires.png, pdf)
