fillplots API
-
class
fillplots.Plotter(regions, config='default', xlim=(-10, 10), ylim=(-10, 10))¶ Plotter to fill regions with colors.
Parameters: “Region specifier” is a list of “inequality specifiers”. Each “inequality specifier” is a tuple of
(data[, less[, domain]]).data is either a callable or a number. If it is a callable, this defines y of boundary as a function of x. If it is a number it is a vertical boundary, inidicated by that number.
less is a bool. True means < (less than) and False means > (larger than). Default is False.
domain is a pair
(min, max)which indicates defined region of the function. It can be None, which means that this inequality is defined for any real number.An example of specifying “x^2 > 0 and x + 5 > 0” is:
>>> plotter = Plotter(
...     [  # Regions:
...         [  # Inequalities:
...              (lambda x: x ** 2,),  # <-- Boundary data
...              (lambda x: x + 5,)
...         ],
...     ])
Internal representation
You can access internal representation as follows. First,
regionsattribute of this class holds a list ofBaseRegioninstances:>>> plotter.regions [<fillplots.regions... object at 0x...>]
Each region object has
inequalitiesattribute, which holds a list ofBaseInequalityinstances:>>> plotter.regions[0].inequalities [<fillplots.inequalities... object at 0x...>, <fillplots.inequalities... object at 0x...>]
Finally, each inequality object has
boundaryattribute to hold an instance ofBaseBoundary.>>> plotter.regions[0].inequalities[0].boundary <fillplots.boundaries... object at 0x...>
Configuration interface
Each of these “layer” has an instance of
Configobject whose attributes can be modified.>>> plotter.regions[0].inequalities[0].boundary.config <fillplots.core.Config object at 0x...> >>> plotter.regions[0].inequalities[0].config <fillplots.core.Config object at 0x...> >>> plotter.regions[0].config <fillplots.core.Config object at 0x...> >>> plotter.config <fillplots.core.Config object at 0x...>
Modifying upstream configuration propagates to downstream configuration. Let’s consider the following configuration:
>>> plotter.config.line_args['ls'] = 'dotted'
>>> plotter.config.line_args['lw'] = 8
>>> plotter.regions[0].inequalities[0].config.line_args['ls'] = 'dashed'
The boundary object of the 0th inequality mixes the configurations of the inequality and the root plotter object.
>>> plotter.regions[0].inequalities[0].boundary.config.line_args['ls']
'dashed'
>>> plotter.regions[0].inequalities[0].boundary.config.line_args['lw']
8
The configuration for the 0th inequality does not effect to the 1st inequality and its down stream. So, the configuration of the root plotter object is used:
>>> plotter.regions[0].inequalities[1].boundary.config.line_args['ls']
'dotted'
-
config¶ An instance of
Config.You can’t set this attribute (i.e.,
self.config = configraises an error). Useconfig._set_baseinstead.
-
ax¶ matplotlib.axes.Axesinstance used by this plotter.
-
plot()¶ Plot regions and boundaries.
-
plot_boundaries()¶ Plot boundaries.
-
plot_positive_direction()¶ Plot direction that makes LHS of the inequality positive.
-
plot_regions()¶ Plot regions.
-
-
fillplots.plot_regions(regions, *args, **kwds)¶ Create
Plotterobject and call plot function of it.All arguments are passed to
Plotter.Return type: Plotter
-
fillplots.boundary(function_or_number, domain=None)¶ Boundary factory function.
Parameters: - function_or_number (callable or number) – If it is a callable, it is assumed to be a function that maps x to y. If it is a number, the boundary is a straight line specified by x = <number>.
- domain ((number, number) or None) – The boundary is defined on this domain. If it is None, the boundary is defined for any real number. If the argument function_or_number is a callable, the domain is on x-axis. If function_or_number is a number, the domain is on y-axis.
Return type: Returns: An instance of
BaseBoundarysubclass.
-
fillplots.annotate_regions(regions, text, horizontalalignment='center', verticalalignment='center', **kwds)¶ Annotate regions with text.
Put only one annotation for each contiguous group of regions.
Parameters: - regions (list of
BaseRegion) – These regions are annotated with the same text. - text (str) – Annotation text.
Other keywords are passed to
matplotlib.axes.Axes.text().- regions (list of
Internal classes
These classes are not meant to initialized from outside of this library.
But you can access their instance via Plotter and call their
methods.
-
class
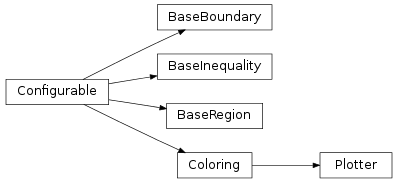
fillplots.core.Configurable(baseconfig)¶ -
config¶ An instance of
Config.You can’t set this attribute (i.e.,
self.config = configraises an error). Useconfig._set_baseinstead.
-
ax¶ matplotlib.axes.Axesinstance used by this plotter.
-
-
class
fillplots.inequalities.BaseInequality(baseconfig, data, less=False, domain=None)¶ -
boundary= None¶ An instance of
BaseBoundaryinstance.
-
plot_positive_direction()¶ Plot direction that makes LHS of the inequality positive.
-
-
class
fillplots.regions.BaseRegion(config, ineqs)¶ -
inequalities= None¶ List of
BaseInequalityinstances.
-
plot_boundaries()¶ Plot boundaries.
-
plot_region()¶ Plot this region.
-
Configuration interface
-
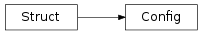
class
fillplots.core.Config(*args, **kwds)¶ Configuration interface.
See also
Struct, which is a parent class of this class.-
line_args= None¶ Arguments passed to
matplotlib.axes.Axes.plot()ormatplotlib.axes.Axes.axvline().Default is {}.
-
fill_args= None¶ Arguments passed to
matplotlib.axes.Axes.fill_between().It can take additional keyword argument autocolor, which is not defined in matplotlib. autocolor can be used to set facecolor and edgecolor to the same color. If facecolor is specified, it is used. Otherwise, the color is generated from
fill_color_cycle. The reason to add this argument is because it looks like that there is no good way to eliminate edge color natively by matplotlib [1].Default is {}.
[1] See: http://stackoverflow.com/questions/14143092/ http://permalink.gmane.org/gmane.comp.python.matplotlib.general/996
-
num_boundary_samples= None¶ Number of points to be used to draw boundaries.
Default is 1000.
-
num_com_samples= None¶ Number of points to be used to estimate center of mass of region.
Default is 50.
-
num_direction_arrows= None¶ Number of arrows per boundary to indicate positive directions.
Default is 5. It is used by
fillplots.api.Plotter.plot_positive_direction()etc.
-
direction_arrows_size= None¶ Size of direction arrow as a ratio to axis length.
Default is 0.03. See also
num_direction_arrows.
-
-
class
fillplots.utils.chainstruct.Struct(*args, **kwds)¶ Chain-able struct (Like ChainMap, but for dot-access).
>>> zero = Struct()       # most upstream struct
>>> one = Struct(zero)
>>> two = Struct(one)     # most downstream struct
Setting attributes of the upstream objects “propagate” to downstream objects.
>>> zero.alpha = 0
>>> two.alpha
0
>>> one.alpha = 1
>>> (zero.alpha, one.alpha, two.alpha)
(0, 1, 1)
Structhas special treatment for dictionary attributes. Dictionaries of the same attribute in the upstream structs are mixed in the down stream structs.>>> zero.beta = {'gamma': 10} >>> one.beta = {'delta': 20} >>> two.beta['gamma'] 10 >>> two.beta['delta'] 20 >>> two.beta == {'gamma': 10, 'delta': 20} True
Note that changing downstream dictionaries does not change upstream ones.
>>> 'delta' in zero.beta
False
>>> two.beta['epsilon'] = 30
>>> 'epsilon' in one.beta
False
Setting whole dictionary works as expected.
>>> one.beta = {'gamma': 110, 'delta': 120}
>>> two.beta['gamma']
110
>>> two.beta['delta']
120